Innovation Table
The Innovation tab is designed to provide a comprehensive and visual overview of the innovations being supported across the Health Innovation Networks.
Access Control
IRLSS Commissioners: Have full access to this tab and can utilize all "Advanced Filters" to explore and compare the innovation landscape across the entire national network.
How to Use This Page
Innovation Tree Map
The dashboard features an interactive Tree Map that visually organizes innovations by their Care Setting (e.g., GP Primary Care, Acute Trust - Inpatient, Person's home, etc.).
Categorization: Each large colored block represents a Care Setting.
Clinical/Non-clinical Areas: Within these blocks, innovations are further grouped by clinical areas (like CVD, Cancer, or Infections) or non-clinical functions.
Innovation type: Within a selected Care Setting and Clinical Area, innovations can be categorised further based on their Innovation Type.
Volume Visualization: The size and density of the small squares within each section indicate the volume of innovations currently active in that specific area.
Advanced Filters
Use the collapsible "Advanced Filters" section to refine the innovation data displayed in both the Tree Map and the table below.
Filters can be applied to any column and work together to refine the table. Selecting multiple filters will narrow results to records that meet all criteria, while selecting multiple values within a single filter will include records matching any of those values (for example, innovations in primary care, secondary care, or both).
Available filters include:
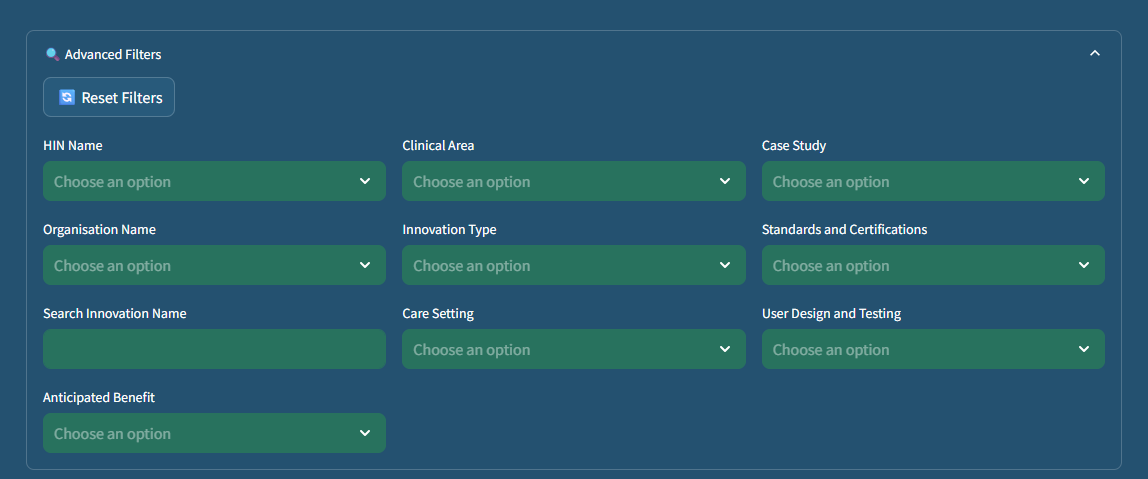
Health Innovation Network Name: Select specific networks to view their innovation portfolio.
Organisation Name: Filter by the specific company or organisation responsible for the innovation.
Search Innovation Name: Use the text field to find a specific innovation quickly by its title.
Anticipated Benefit: Filter innovations by anticipated benefits.
Clinical Area: View innovations targeting specific medical fields.
Innovation Type: Filter by categories such as Medical device, Digital, or Pharmaceutical.
Care Setting: Narrow down results based on where the innovation is used (e.g., GP Primary Care, Acute Trust, or Social Care).
Case Study: Filter to show only innovations that have an associated case study documented.
Standards and Certifications: Filter by regulatory or quality milestones achieved.
USer Design and Testing: Filter innovations by the type of User Design and Testing applied.
Resetting Filters: Click the Reset Filters button at any time to clear all current selections and restore the full dataset.
Innovation Results Table
Detailed data corresponding to your filters is displayed in the table at the bottom of the page:
Table Columns:
- No.: The unique row identifier.
- Health Innovation Network Name
- Innovation Name
- Innovation Type
- Innovation Type - Other
- Care Setting
- Care Setting - Other
- Clinical Area
- Clinical Area - Other
- Anticipated Benefit
- Anticipated Benefit Timeline
- Standards and Certifictions
- Standards and Certifictions - Other
- User Design and Testing
- Case Study
- Organisation Name
Total Row Count: The Total Number of Rows is displayed below the table, showing the total count of unique innovations that match your current filter settings.