Metrics per HIN
The Metrics per Health Innovation Network tab is designed to provide a granular view of performance, innovation, and financial data for a specific Health Innovation Network (HIN).
Access Control
IRLSS Commissioners: Have full access to this tab and can use the "Select Health Innovation Network" dropdown menu to switch between different networks to compare data.
Individual Health Innovation Network Users: Will automatically see the metrics specific to their own network upon login.
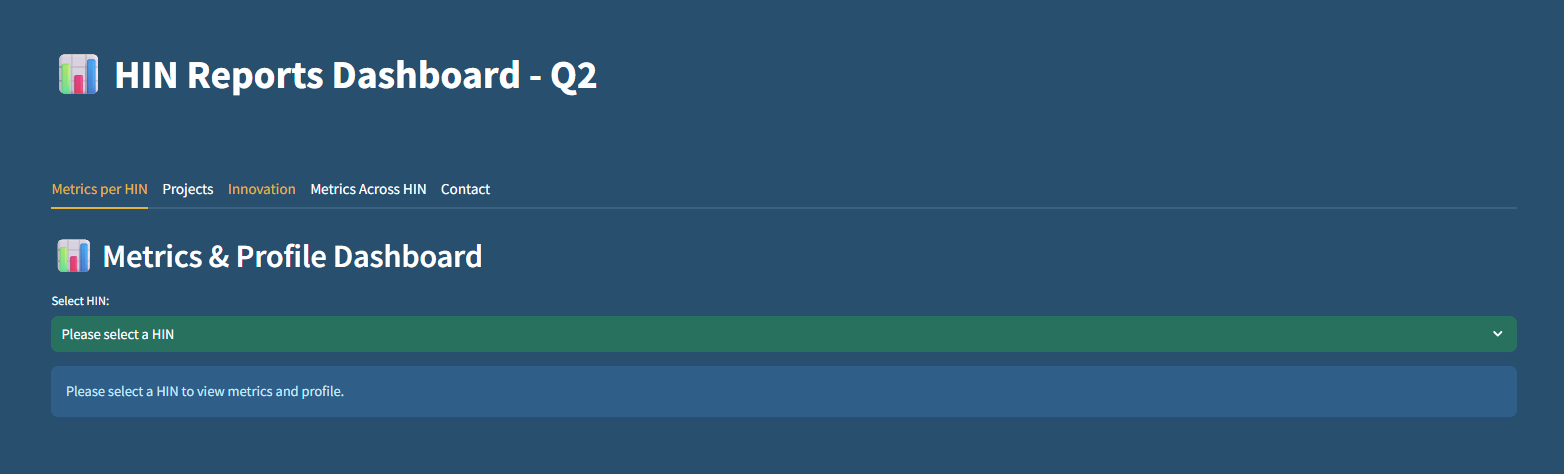
How to Use This Page
Selection: If you are an IRLSS Commissioner, use the "Select Health Innovation Network" dropdown at the top of the page to choose a specific network (e.g., Health Innovation East Midlands).
Summary Cards:
At a glance, you can view the primary Key Performance Indicators (KPIs):
Companies: Total number of companies reported by the Health Innovation Network. This is calculated as the total count of unique entries in the CDS Organisation Name field reported by the HIN.
Active Innovations: Total number of innovations where the organisation’s last contact date falls within the reporting quarter. This is calculated as the total count of innovations from the CDS Innovation Name field where the CDS Organisation Date of Last Contact field meets the reporting quarter criteria.
Innovation Case Studies: Total number of innovations with a case study reported by the HIN. This is calculated as the total count of active innovations where the CDS Case Study field equals “YES”.
Total Headcount: Total number of employees. Information is directly provided by the HIN in the CDS HIN Profile tab.
Data Breakdowns
The dashboard provides three primary sections for deeper analysis:
-
Project & Innovation Overview This section tracks the efficiency and volume of work:
Median Project Duration: Median duration of live projects. This is calculated as the median of the difference between the CDS Project End Date field and the CDS Project Start Date field.
Projects w/ Innovation: Total number of projects with an associated innovation reported by the HIN. This is calculated as the total count of entries in the CDS Project Name field where a CDS Innovation Name is linked to the project in the CDS Project tab.
Total Project Count: Total number of projects reported by the HIN.
Project Status Distribution: A donut chart showing the lifecycle of projects categorized by Project proposal, Approved (not started), Live projects/Sub projects, and Closed projects.
-
Revenue Overview A financial snapshot of the Health Innovation Network’s funding and income:
Revenue Total: The total sum of revenue for the period.Total income (GBP) from IRLSS, OLS, and Patient Safety Collaborative commissions for the reporting quarter. Information is directly provided by the HIN in the CDS HIN Profile tab.
Revenue Distribution: A donut chart breaking down income sources by stream, specifically:
- IRLSS - OLS - PSC -
Workforce Overview A detailed look at the human resources supporting the network:
Total WTE: Total number of current employees (WTE) within the HIN, regardless of funding source. Information is directly provided by the HIN in the CDS HIN Profile tab.
Workforce Breakdown: A bar chart displaying staff distribution across different pay bands or roles (e.g., wte_8a through wte_esm).
-
Narrative Statements On the right-hand side of the workforce section, you will find expandable Statement boxes. These provide qualitative context to the numbers:
Projects Statement: Qualitative updates on project progress.
Health Innovation Network Statement: General updates from the network leadership.
Finance Statement: Contextual notes regarding budget and spending.