Project Table
The Projects tab is designed to provide a comprehensive, searchable database of all projects managed across the Health Innovation Networks.
Access Control
IRLSS Commissioners: Have full access to this tab and can use advanced filters to view and compare projects across all Health Innovation Networks simultaneously.
How to Use This Page
Advanced Filters: Use the collapsible "Advanced Filters" section to narrow down the project list.
Filters can be applied to any column and work together to refine the table. Selecting multiple filters will narrow results to records that meet all criteria, while selecting multiple values within a single filter will include records matching any of those values (for example, projects with a green or amber RAG rating).
You can filter by:
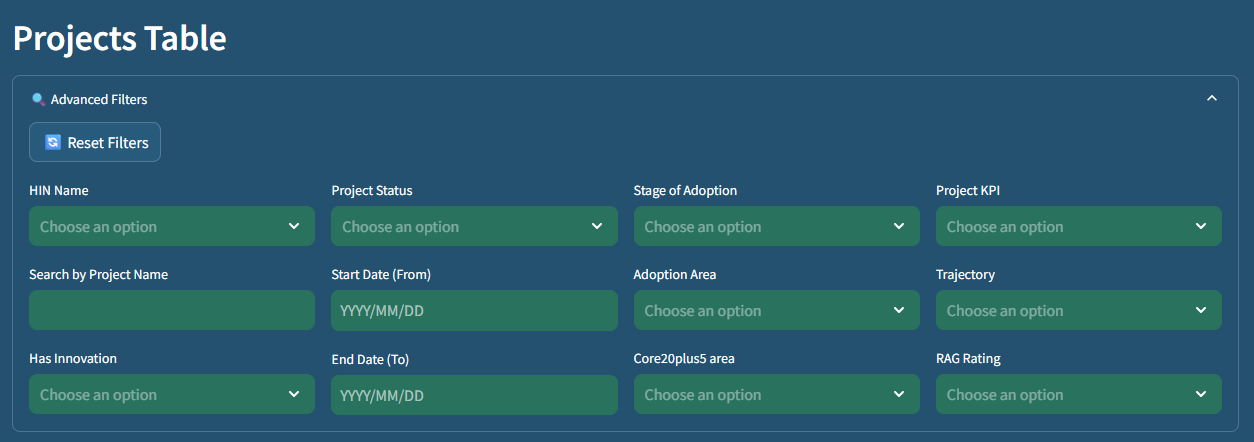
Health Innovation Network Name: Select specific networks to view.
Keyword Search: Use "Search by Project Name" to find specific initiatives quickly.
Has Innovation: Select projects that have/have not an associated Innovation.
Project Status: Filter by stages such as Live, Closed, or Approved.
Date Ranges: Use "Start Date (From)" and "End Date (To)" to find projects active duriTrajectory: Select projects that have/have not an associated trajectory.
Adoption Area & Stage: View projects based on their clinical area or maturity level.
Core20plus5: Filter projects by Core20PLUS5 are of activity.
Project KPI: Select projects that have/have not an associated KPI.
Trajectory: Select projects that have/have not an associated Trajectory.
RAG Rating: Filter projects by their Red, Amber, or Green delivery status.
Resetting Filters: To clear all selections and return to the full list, click the Reset Filters button.
Project Results Table
The filtered results are displayed in a dynamic table below the filter section:
Table Columns:
- No.: The unique numerical identifier for the entry.
- Health Innovation Network Name
- Project Name
- Project Description
- Project Status
- Adoption Area
- Stage of Adoption
- Project Start date
- Project End date
- Project KPI
- Trajectory
- Project RAG
- RAG Comment
- Core20plus5 Text
- Innovation Name
- Has Innovation
Total Row Count:
Underneath the table, the dashboard displays the Total Number of Rows, allowing you to see exactly how many projects meet your current filter criteria at a glance.